How We Design Better Indicators?
Create more useable, cheaper, and better-quality questionnaire-based research
Many people only trust statistics from the Eurostat service, a U.S. federal service, or from their national statistical offices. Our data provided by market research firms with a premium price. Our aim is to create open key business performance indicators, evidence-based policy indicators and other statistical indicators for academic research that has a similar or higher level of usability, reliability, and quality. We want to fill the data gaps for the Music Economy, the Diversity of Circulation of European Music, Music & Society and Music Innovation data left by public authorities and international organization with timely, easy-to-import, easy to use indicators and visualizations.
We work using the agile open collaboration method that allows music organizations, companies, universities, think-tanks, and individual researchers to share data, efforts, and results. We are asking our users to nominate a knowledgeable data curator who communicates the data needs to us. The curators are not data experts: they tell us what their organization or project needs, and they evaluate if our technically sound datasets and visualizations truly meet your needs, or they must be redesigned. We make sure that whatever the data curators approved will be refreshed, if needed, monthly or quarterly, and placed into our data services for free.
Our quality assurance program is sometimes the same as in national statistical offices, and sometimes it is different. We use only open-source statistical software, and we follow the Open Policy Analysis Guidelines for full transparency in our data handling. We send both our software code and our results to scientific peer review, which is often more rigorous than other internal quality controls. We use so-called computerized unit-tests, often almost 100 of them, that search for signs of any data corruption.

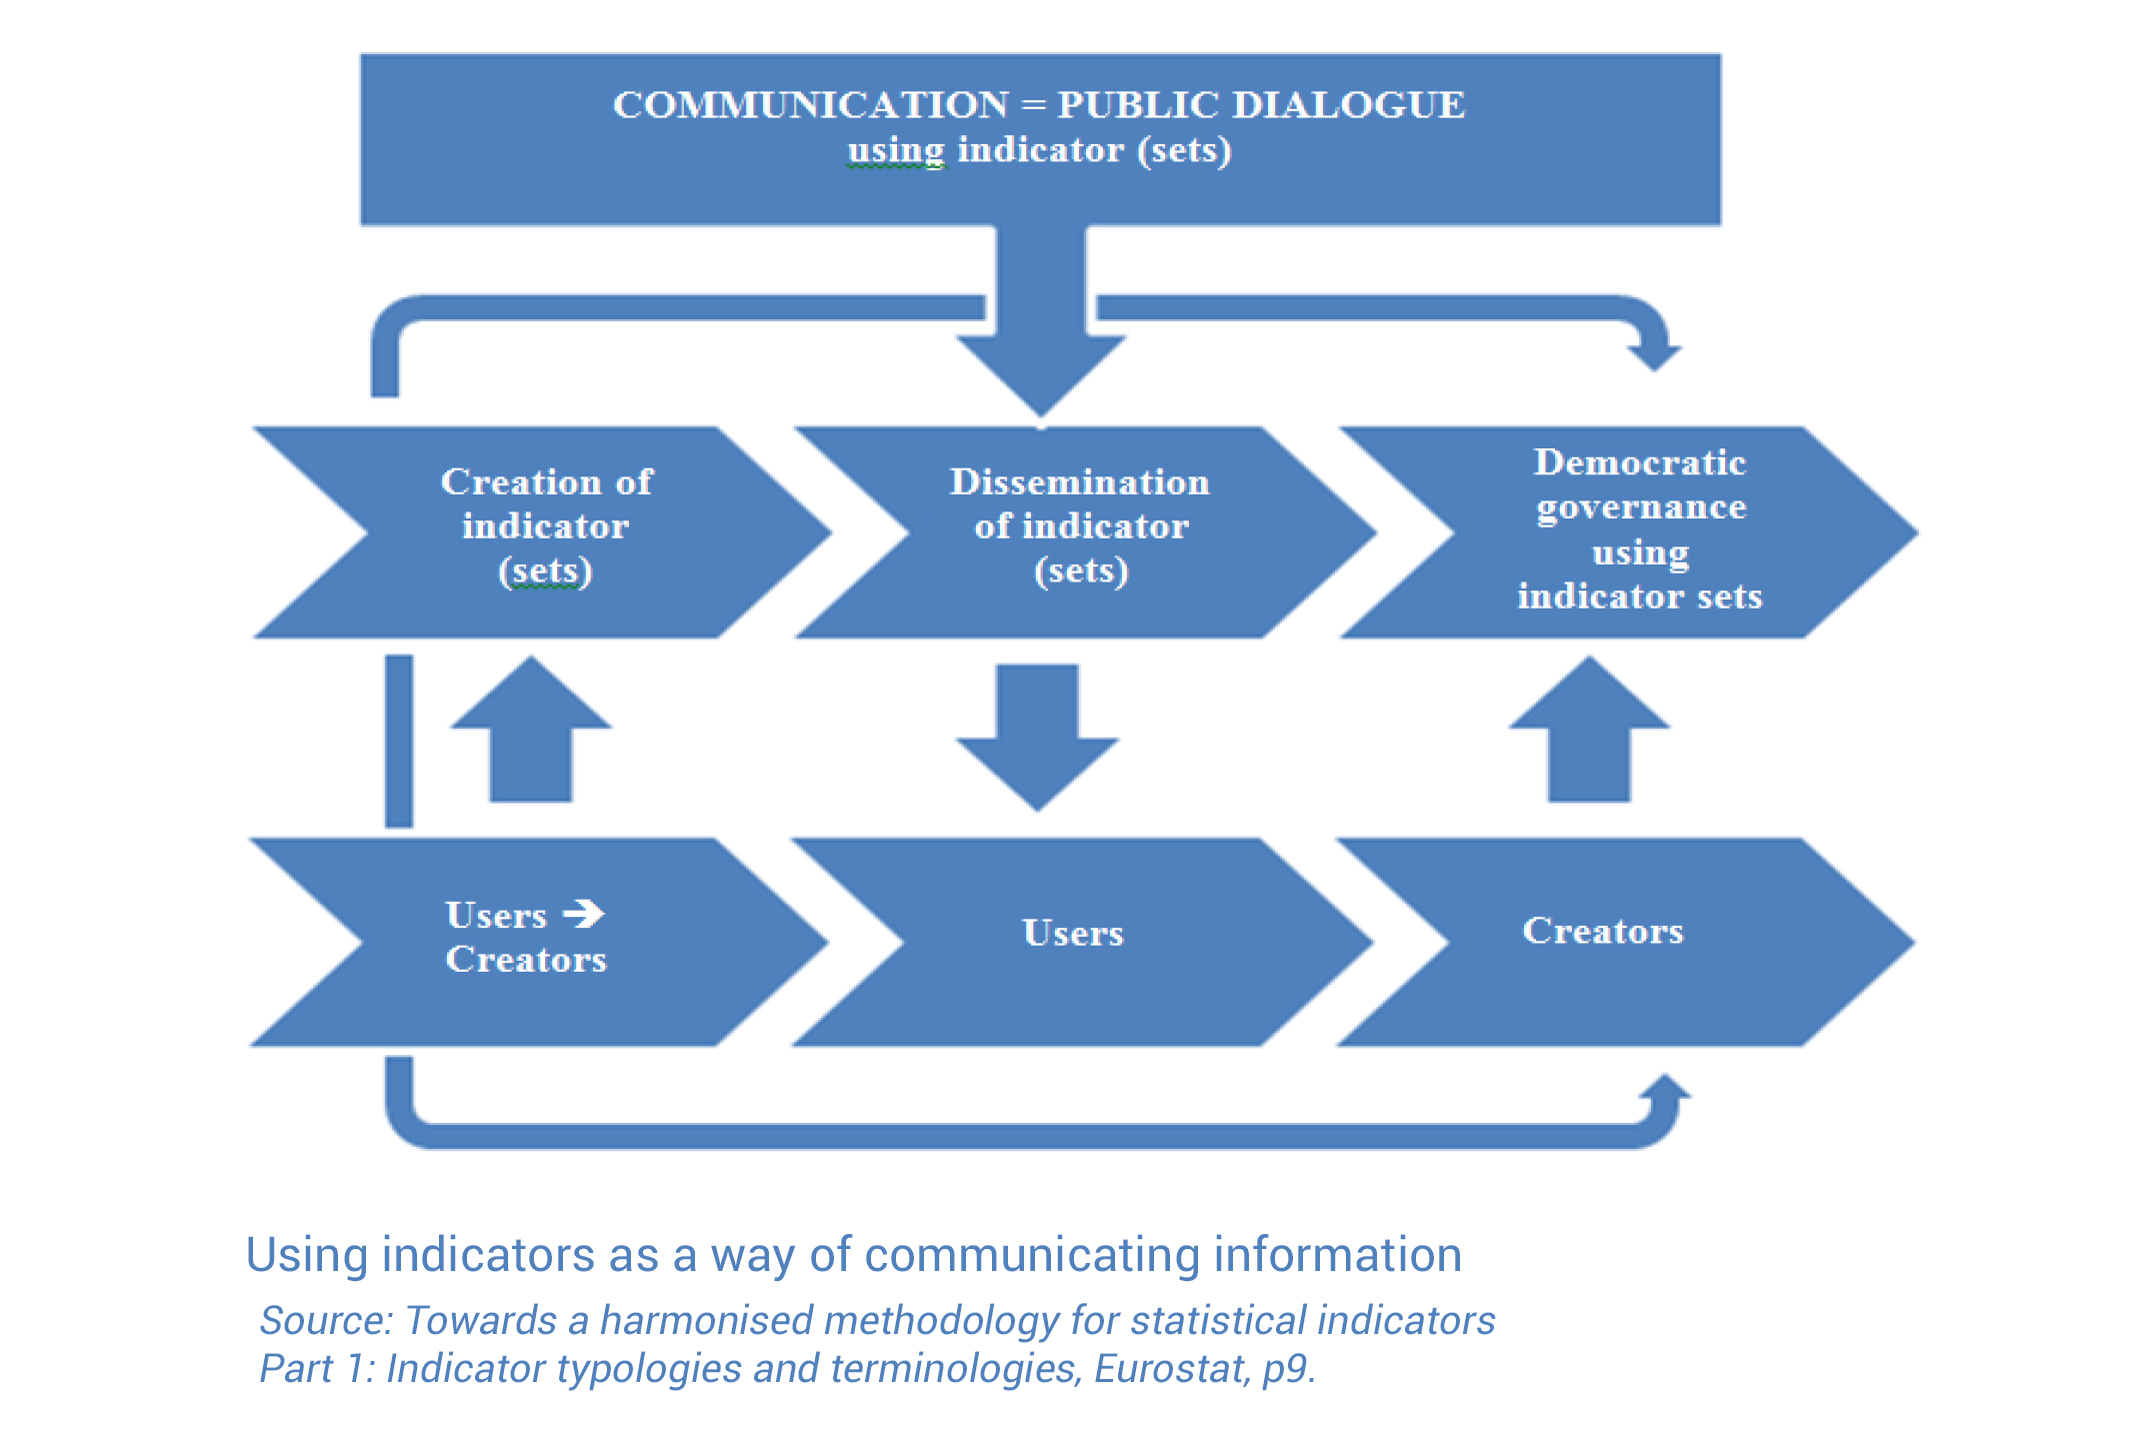
We involve business, policy and academic users in the entire cycle of indicator design to make sure that they receive the information they need in their decision making process or resaerch, and that the information is correct and well documented.
We place the data, the codebook in the EU OpenAire and Zenodo repositories with a DOI and versioning for data integrity, and into the Figshare repository for free, resuable, Creative Commons visualizations.
We have a similar Rest API to the Eurostat data warehouse for automatic database connections. But we always make sure that the data is available in the easiest to use form for SPSS, STATA, Excel, Numbers, or OpenOffice.
Daniel Antal
Data Scientist & Founder of the Digital Music Observatory
My research interests include reproducible social science, economics and finance.